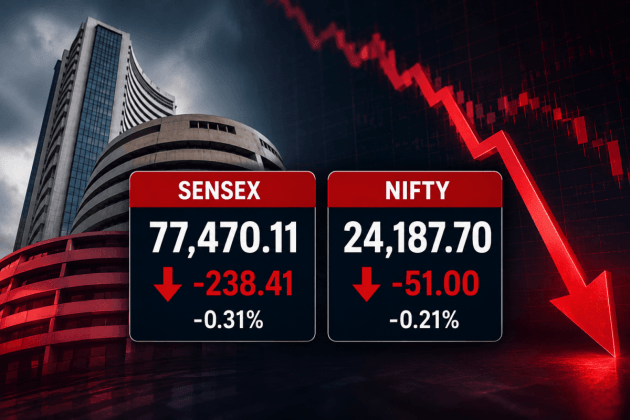
Neutral impactStocks
NSE:NIFTY Chart Image by msubhashish14
TradingView 8 hrs ago·21 Jul 2026, 3:54 am

The Nifty 50 index recently formed a specific chart pattern known as a 'bullish flag.' This technical setup typically appears after a strong upward move, where price consolidates sideways in a rectangle before breaking out to the upside. It is widely viewed by traders as a sign of continued bullish momentum.
For investors, this pattern suggests that the underlying market strength remains intact. It implies that the recent rally has paused for a brief consolidation period rather than reversing direction. This can be a positive signal for those looking for confirmation that the uptrend is sustainable.
Moving forward, market participants should watch for a decisive breakout above the upper resistance level of the flag pattern. A strong volume surge accompanying this breakout would further validate the bullish thesis. Conversely, a failure to break resistance could signal a potential pause in the trend.
Key takeaways
- Category: Stocks.
Why it matters
A routine update. Use the price and stock snapshot to gauge how the market is responding.