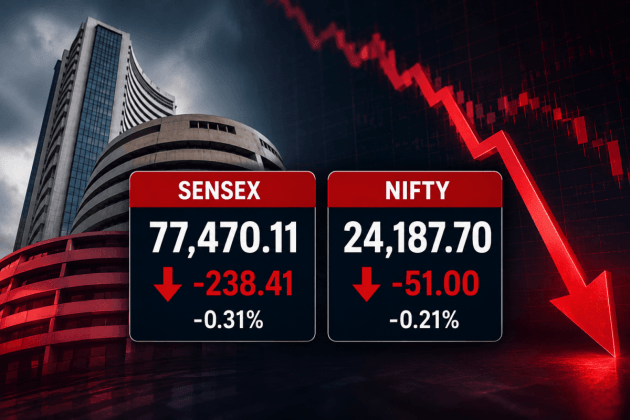
Neutral impactStocks
NSE:NIFTY Chart Image by RainingMoneywithTech
TradingView 8 hrs ago·21 Jul 2026, 3:54 am

The Nifty 50 index recently formed a 'death cross' pattern on its daily chart, a technical signal that has historically preceded market corrections. This occurs when the short-term moving average crosses below the long-term moving average, suggesting a shift in momentum from bullish to bearish.
For investors, this development signals that short-term selling pressure is currently overpowering the long-term uptrend. While a death cross does not guarantee a market crash, it often serves as a warning sign for volatility and a potential pullback in broader indices.
Investors should watch for key support levels and volume trends to gauge the strength of any upcoming move. Maintaining a diversified portfolio and avoiding panic selling during such phases are prudent strategies for navigating market uncertainty.
Key takeaways
- Category: Stocks.
Why it matters
A routine update. Use the price and stock snapshot to gauge how the market is responding.