Positive impactCompany
Piramal Pharma Forms An Ascending Triangle Pattern Hinting At A Near-Term Bullish Reversal
Trade Brains 1 hr ago·11 Aug 2026, 2:00 am
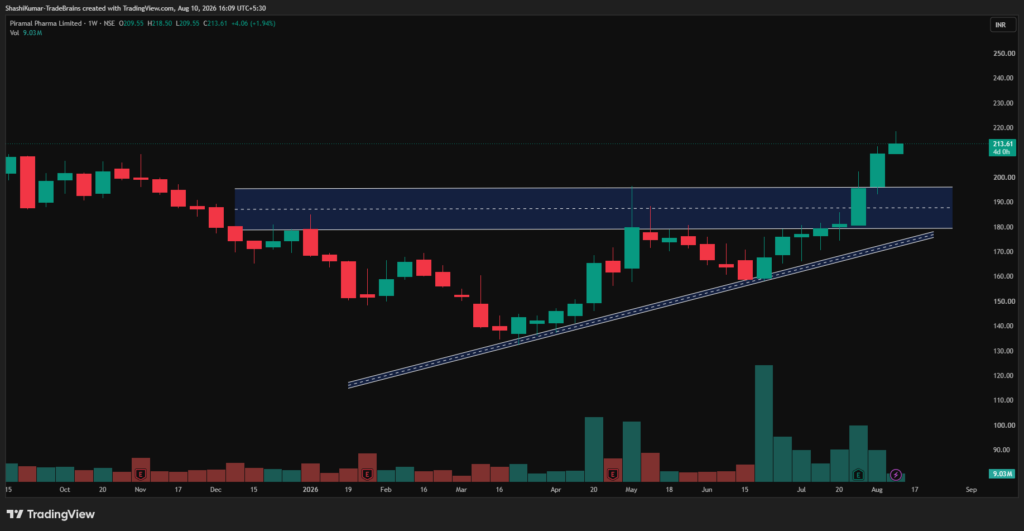
Piramal Pharma has formed an ascending triangle pattern on its weekly chart, which is a technical setup often seen as a sign of a potential bullish reversal. This pattern is defined by a series of higher lows and a flat resistance level. The formation suggests that the stock's price is consolidating and that buyers are stepping in at higher levels, preparing for a move upward.
For investors, this technical signal indicates that the stock may be poised for a short-term rally if it successfully breaks above the resistance line. A breakout is typically accompanied by an increase in trading volume, which adds conviction to the move. Investors should monitor the stock's price action closely to see if it can sustain the momentum above this key resistance level.
Moving forward, the focus will be on whether the stock can maintain its position above the resistance line. A failure to break out could lead to a continuation of the current consolidation phase. Investors should keep an eye on broader market trends and company-specific news to gauge the sustainability of any potential upward move.
Key takeaways
- Category: Company.
- AI reads the tone as positive (potentially bullish) for the stock.
Why it matters
A routine update. The tone is positive — historically associated with upward pressure, though not predictive. Use the price and stock snapshot to gauge how the market is responding.