Positive impactStocks
LTM among 5 stocks flashing bullish signals, indicating possible uptrend
Economic Times 2 hrs ago·4 Aug 2026, 3:17 am
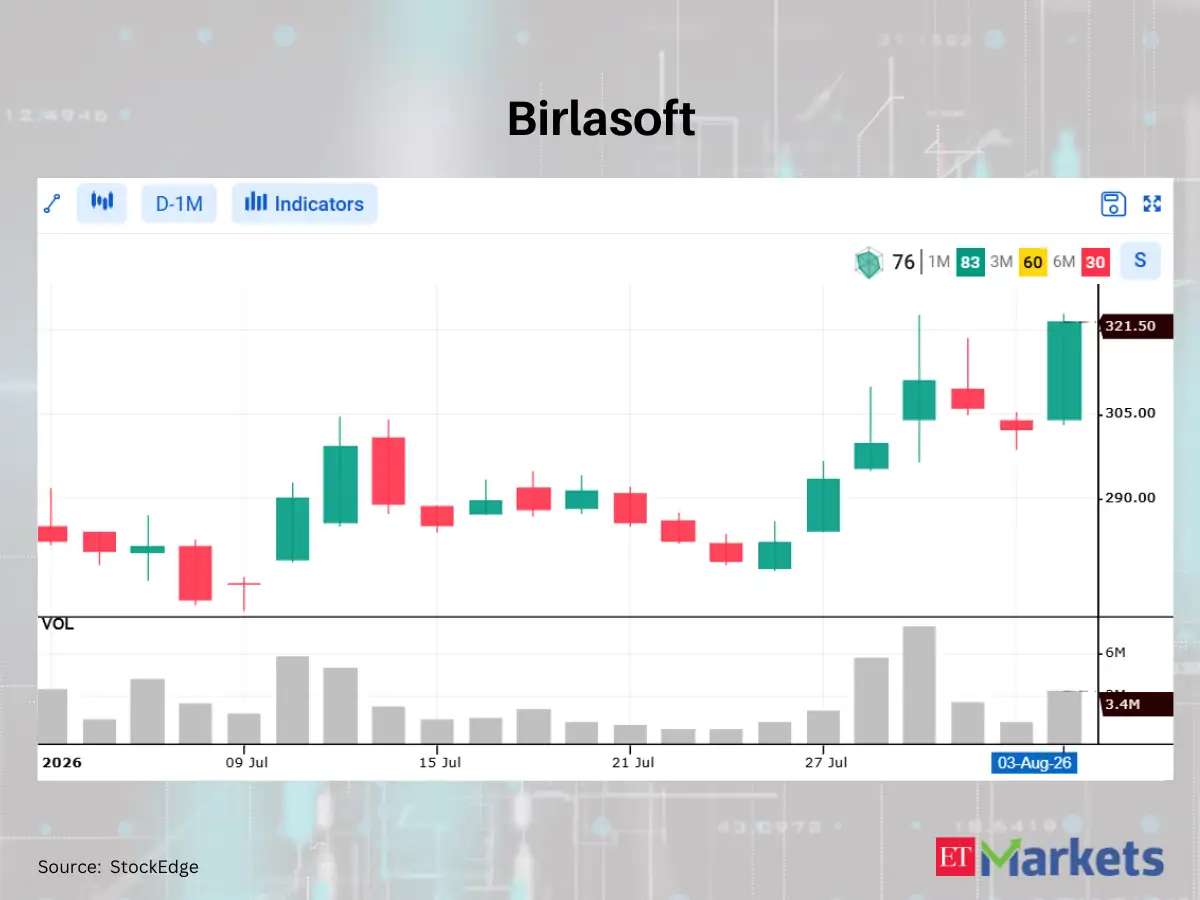
LTM has recently shown strong technical strength, with its stock price moving significantly higher. This performance is highlighted by the formation of a White Marubozu candlestick, a chart pattern that indicates strong buying momentum and a lack of selling pressure during the session. This specific pattern suggests that buyers were in control throughout the trading day, pushing the price to its high and closing near the high.
For investors, this technical signal is often viewed as an indication of a potential uptrend. When a stock forms such a candle, it can signal renewed investor confidence and a shift in market sentiment. However, technical patterns are not guarantees of future performance and should be considered alongside other fundamental factors.
Investors should monitor the stock's price action in the coming sessions to see if this momentum continues. A breakout above recent resistance levels would support the bullish view, while a failure to sustain the gains could indicate a temporary rally. It is important to keep a close watch on volume and broader market trends to gauge the strength of this move.
Affected stocks
Bullish1 stock
Bull / bear label is derived from the article's AI sentiment — indicative, not advice. Prices may be delayed.
Key takeaways
- Concerns LTM (LTM).
- Category: Stocks.
- AI reads the tone as positive (potentially bullish) for the stock.
Why it matters
A routine update for LTM. The tone is positive — historically associated with upward pressure, though not predictive. Use the price and stock snapshot to gauge how the market is responding.