India’s CAD widens to $4.2 billion in Q1FY27 from $3.4 billion in Q1FY26
BusinessLine 1 hr ago·1 Sept 2026, 3:10 pm

India's current account deficit (CAD) widened to $4.2 billion in the first quarter of fiscal 2027, up from $3.4 billion in the same period last year. This shift indicates a higher gap between the country's total imports and exports of goods, services, and transfers. While the deficit as a percentage of GDP increased only marginally to 0.5 per cent, it suggests that the nation is spending more on foreign goods and services than it is earning.
For investors, a wider CAD can be a concern as it may require the country to borrow from abroad to finance the gap. This can increase external debt and put pressure on the rupee. However, the market has largely priced in this trend. Investors should focus on the overall health of the economy, including growth rates and foreign capital inflows, rather than reacting to single data points.
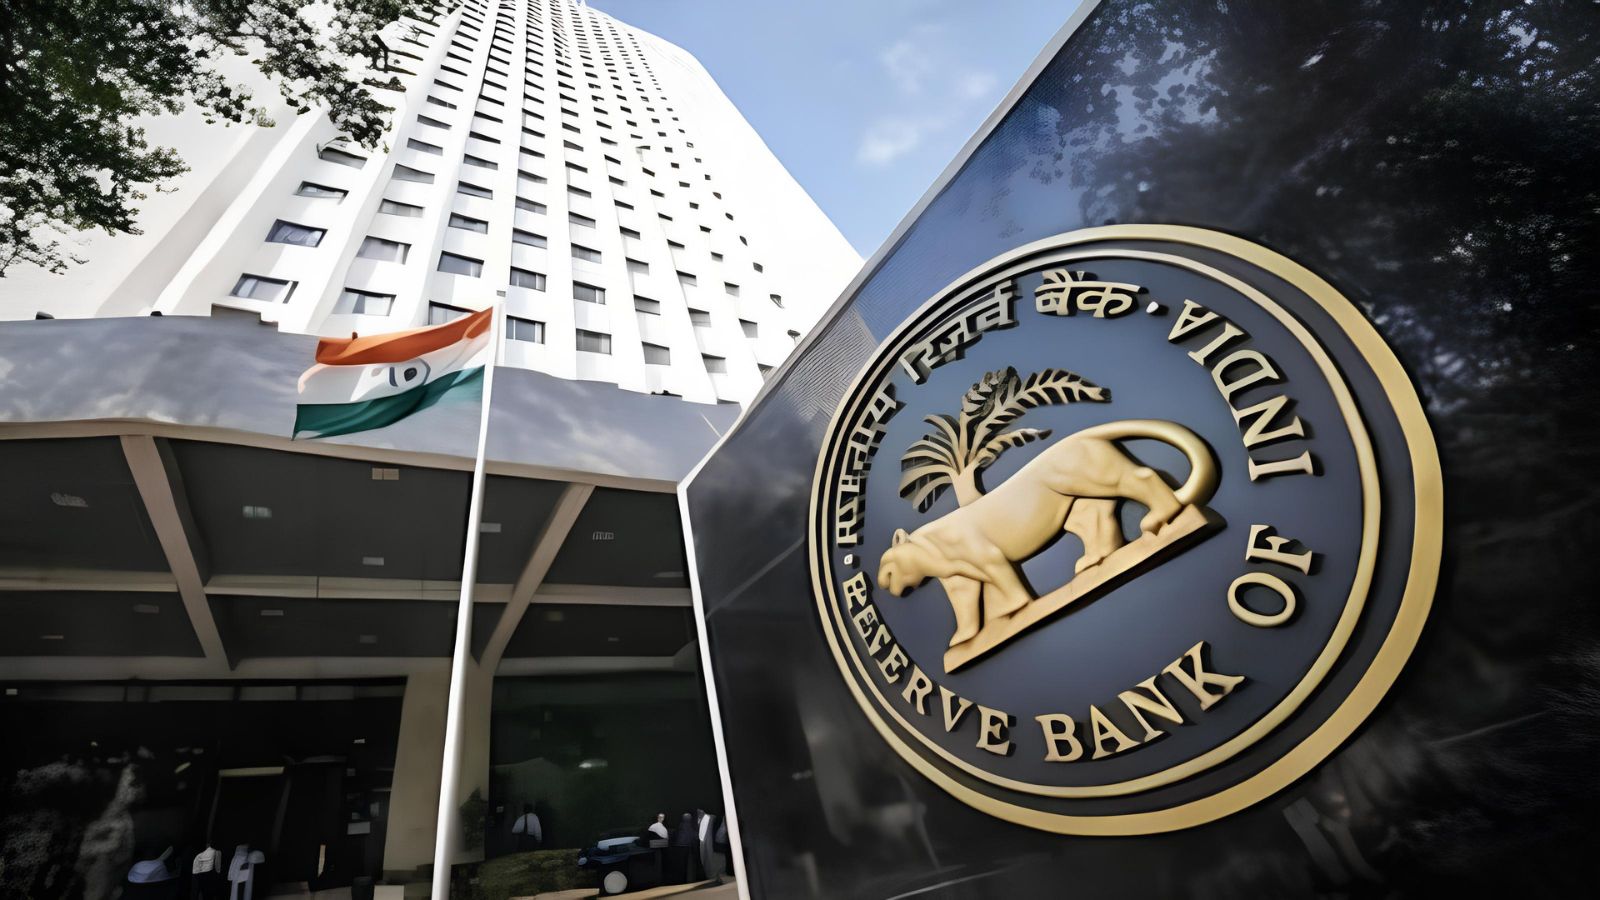
Moving forward, the Reserve Bank of India and the government will closely monitor the trade balance and capital flows. A stable CAD is crucial for maintaining investor confidence. Watch for upcoming data on exports, especially from the IT and pharma sectors, which are key drivers of the country's services exports.
Excerpt from BusinessLine
India’s current account deficit (CAD) widened to $4.2 billion in the first quarter (Q1) of FY27 against $3.4 billion in the year ago quarter due to higher merchandise trade deficit. In percentage terms, CAD nudged up marginally to 0.5 per cent of GDP in Q1FY27 from 0.4 per cent Q1FY26. Current account deficit occurs…Read the original at BusinessLine
Key takeaways
- Category: Results.
- AI reads the tone as negative (potentially bearish) for the stock.
- Flagged as a high-impact, market-moving story.
Why it matters
This is a high-impact development and could move the stock. The tone is negative — watch for downside reaction. Use the price and stock snapshot to gauge how the market is responding.