

Thematic Baskets
Indian companies sorted by reported industry into buckets you can actually think in — plus curated cross-sector baskets like defence, railways and EV. Each theme is scored nightly on returns, relative strength and breadth, then labelled trending, turning around, cooling or weak.
37 themes4,198 companiesComputed 5 Oct 2026
Where the market is rotating
37 themes classified nightly
- Trending
- 2
- Turning around
- 1
- Cooling
- 12
- Weak
- 22
Sorted by what the company actually does
Derived from each company's reported industry, so a name sits in at most one bucket. A small number of listings carry no industry upstream and are not shown here. Sorted by size.































































































































































Curated cross-cutting baskets
Hand-picked lists that cut across industries — a defence name can be an engineering company, a shipbuilder or an electronics maker. Membership here is editorial, not measured.






























Leaders & laggards
3-month relative strength, cap-weighted · 5 Oct 2026
Leading the market
Furthest ahead of DocStoX universe (5,391 companies) over three months.


Lagging the market
Furthest behind over the same window — the other end of the same ranking.


See the full rankingAll 37 ranked themes, with 1M/3M/6M and cap- vs equal-weighted toggles.37 themes
Theme rotation
Every theme ranked by its 3 months move, against DocStoX universe (5,391 companies). Computed 5 Oct 2026.
#ThemeCap-weighted 3 months movevs universeState
- 1Capital Goods & Engineering349 companies+31.2%+30.4ppTrending
- 2Telecom14 companies+29.2%+28.4ppTrending
- 3Real Estate66 companies+10.3%+9.5ppCooling
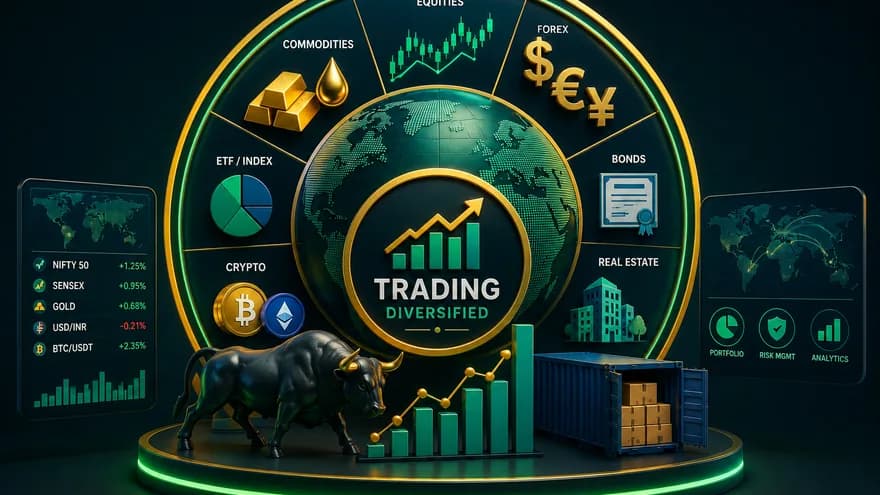
- 4Trading & Diversified265 companies+5.7%+4.9ppCooling
- 5Auto & Auto Components86 companies+5.4%+4.6ppCooling
- 6AI & Data Centre10 companies+4.4%+3.6ppCooling
- 7Packaging & Paper218 companies+4.3%+3.5ppCooling
- 8Digital & Internet Platforms79 companies+4.1%+3.3ppCooling
- 9Consumer & Retail90 companies+3.1%+2.3ppCooling
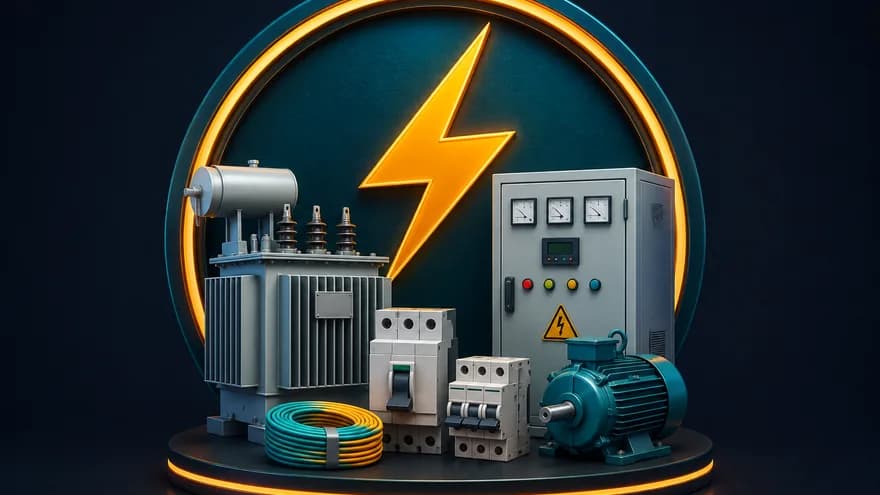
- 10Electrical Equipment & T&D113 companies+3.0%+2.2ppCooling
- 11Jewellery & Luxury53 companies+2.9%+2.1ppCooling
- 12Logistics & Supply Chain107 companies+2.7%+1.9ppCooling
- 13Pharma Majors13 companies+2.3%+1.5ppCooling
- 14Pharma & Healthcare310 companies+1.8%+1.0ppCooling
- 15Electronics & EMS33 companies+0.3%-0.5ppWeak
- 16Metals & Mining253 companies-0.5%-1.3ppWeak
- 17Hospitality & Travel105 companies-1.0%-1.8ppWeak
- 18Oil, Gas & Energy47 companies-1.2%-2.0ppTurning Around
- 19Semiconductor & EMS6 companies-2.3%-3.1ppWeak
- 20IT & AI Services227 companies-2.8%-3.6ppWeak
- 21Specialty Chemicals250 companies-3.3%-4.1ppWeak
- 22Media & Entertainment104 companies-3.6%-4.4ppWeak
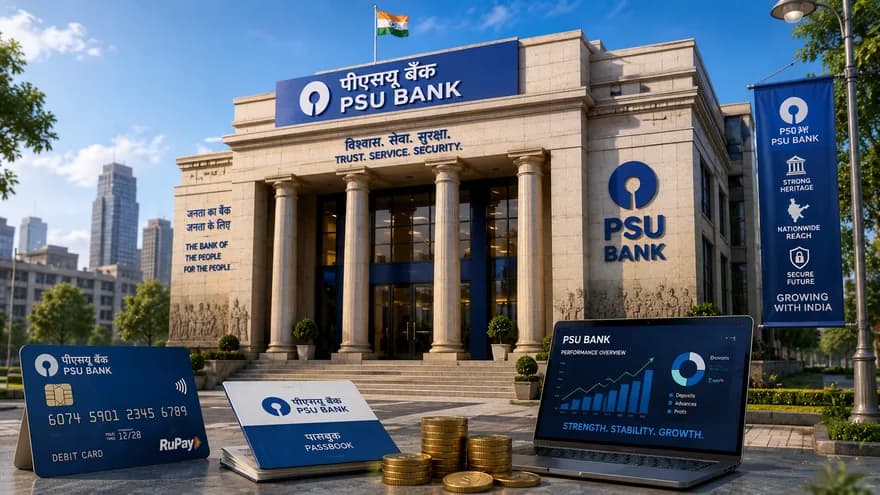
- 23PSU Banks12 companies-4.0%-4.8ppWeak
- 24EV Ecosystem10 companies-4.1%-4.9ppWeak
- 25FMCG & Household101 companies-5.7%-6.5ppWeak
- 26Defence & Aerospace15 companies-6.9%-7.7ppWeak
- 27PSU16 companies-7.2%-8.0ppWeak
- 28Textiles & Apparel217 companies-8.8%-9.6ppWeak
- 29Capital Markets109 companies-9.1%-9.9ppWeak
- 30NBFC & Lending322 companies-9.3%-10.1ppWeak
- 31Insurance12 companies-9.3%-10.1ppWeak
- 32Agriculture & Food Processing290 companies-10.2%-11.0ppWeak
- 33Railways11 companies-10.4%-11.2ppWeak
- 34Infrastructure & Capex186 companies-10.6%-11.4ppWeak
- 35Power & Utilities61 companies-10.8%-11.6ppWeak
- 36Cement & Building Materials119 companies-11.3%-12.2ppWeak
- 37Green Energy & Transition11 companies-16.2%-17.0ppWeak
How these numbers are built
- The benchmark is our own universe
- Relative strength compares a theme with DocStoX universe (5,391 companies). We do not hold index history, so nothing here is a comparison against NIFTY.
- Two weightings, both shown
- The headline is market-cap weighted with a 12% ceiling per company. The equal-weighted figure sits beside it in the full ranking — when the two diverge, the move is narrow.
- Breadth has its own denominator
- Only members with enough price history to carry a 200-day average count towards breadth. Below half a theme's members, we show the coverage and withhold the state label.
- The trend line is a rolling window
- Each card's sparkline plots how that theme's trailing 3-month return has moved across the stored sessions — a shape for trending, turning or rolling over. Themes without enough stored points show no line at all rather than a flat one.
Themes are informational groupings, not recommendations or a portfolio. This is not investment advice — consult a SEBI-registered adviser before investing.