Negative impactSector
Negative Breakout: These 5 stocks cross below their 200 DMAs
Economic Times 1 hr ago·26 Oct 2026, 1:56 am
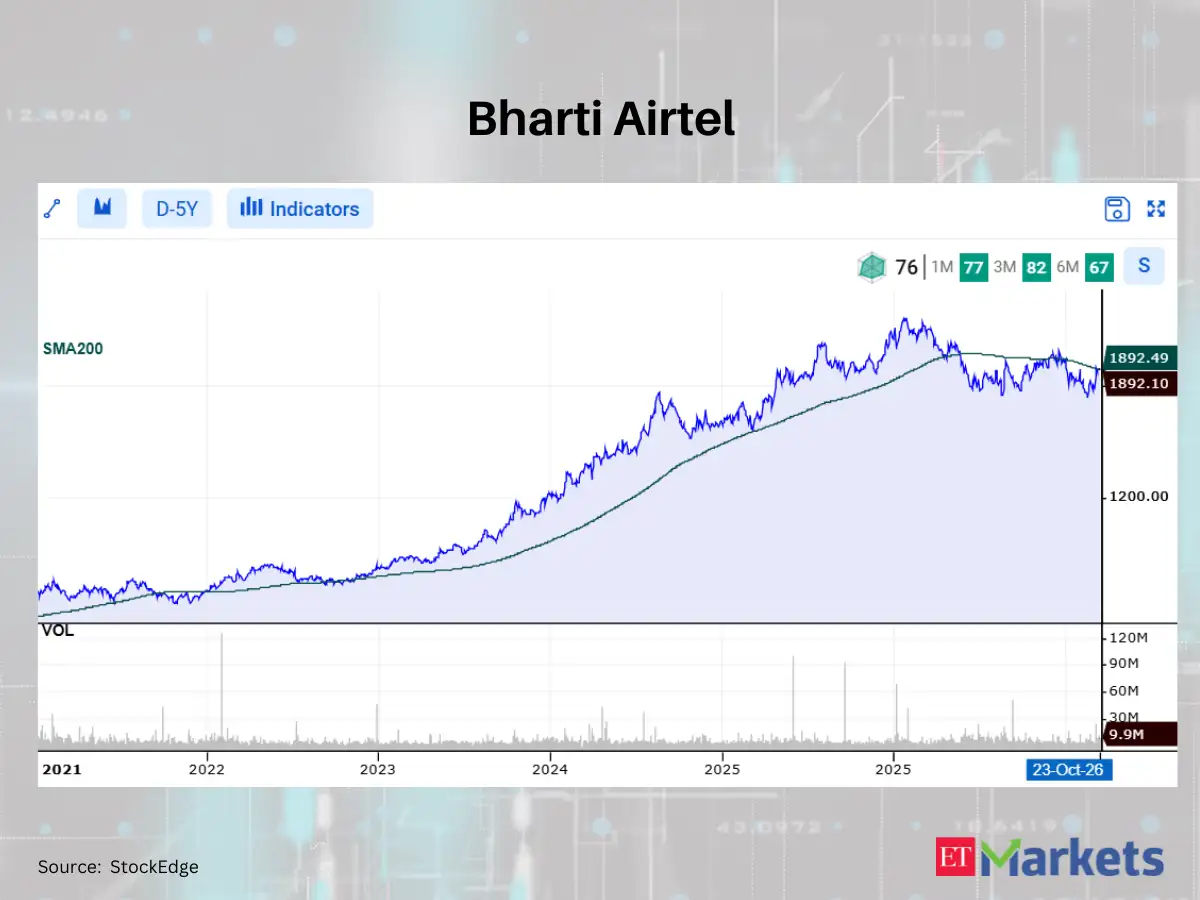
A negative breakout occurs when a stock's price falls below a key technical level, such as its 200-day moving average (DMA). This technical indicator smooths out daily price fluctuations to show the average price over the last 200 trading days, effectively representing the stock's medium-to-long-term trend. When a stock closes below this line, it signals that the prevailing uptrend may have broken down, often interpreted by traders as a bearish signal.
For investors, this development is significant as it suggests the stock's momentum has turned negative. While it does not guarantee a price drop, it indicates that selling pressure is currently stronger than buying pressure. This technical shift can lead to further declines as traders adjust their positions, making it a crucial metric for monitoring the health of a stock's broader trend.
Moving forward, investors should watch for a decisive break below the 200 DMA and subsequent consolidation. If the stock fails to reclaim this level, it may face additional downward pressure. Conversely, a strong rebound above the 200 DMA could signal a potential reversal. Monitoring volume during these moves can also provide additional context on the strength of the breakout.
Excerpt from Economic Times
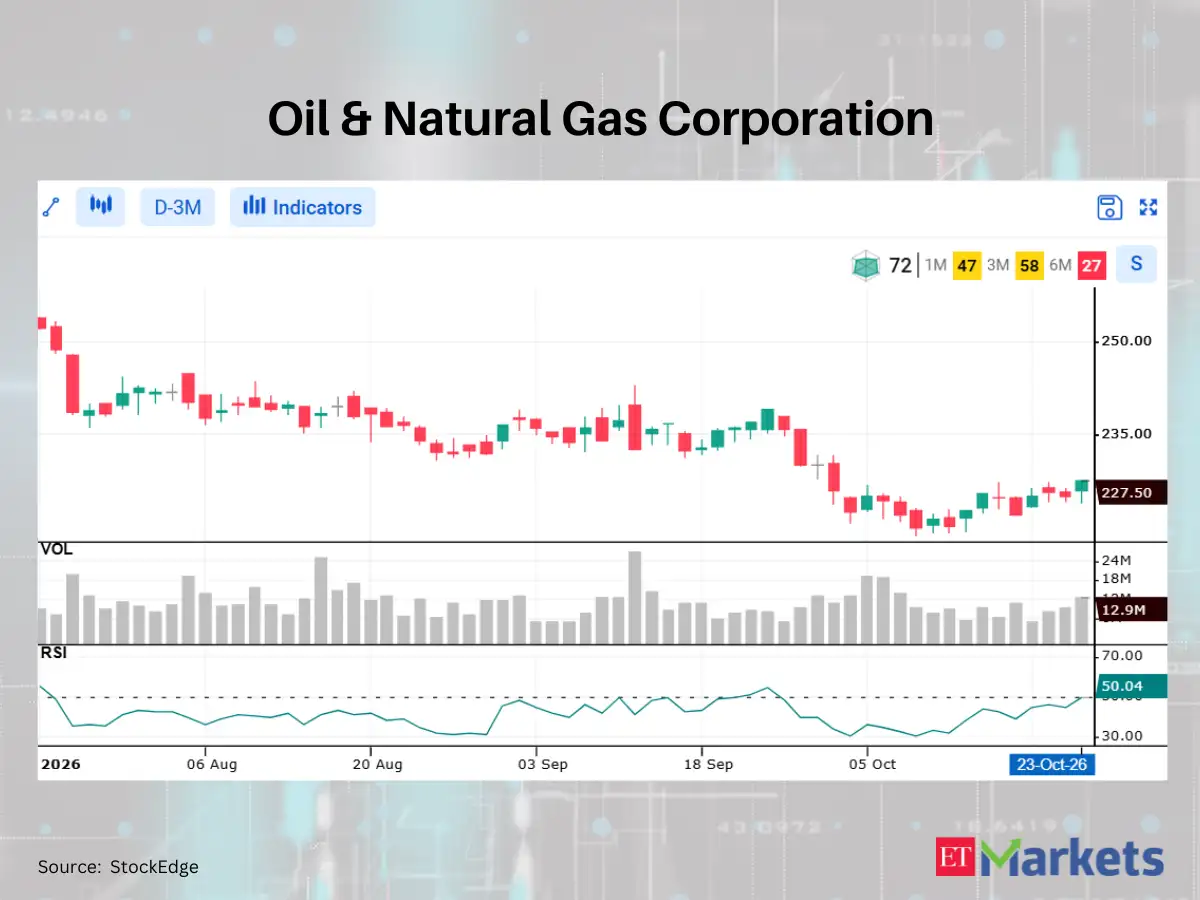
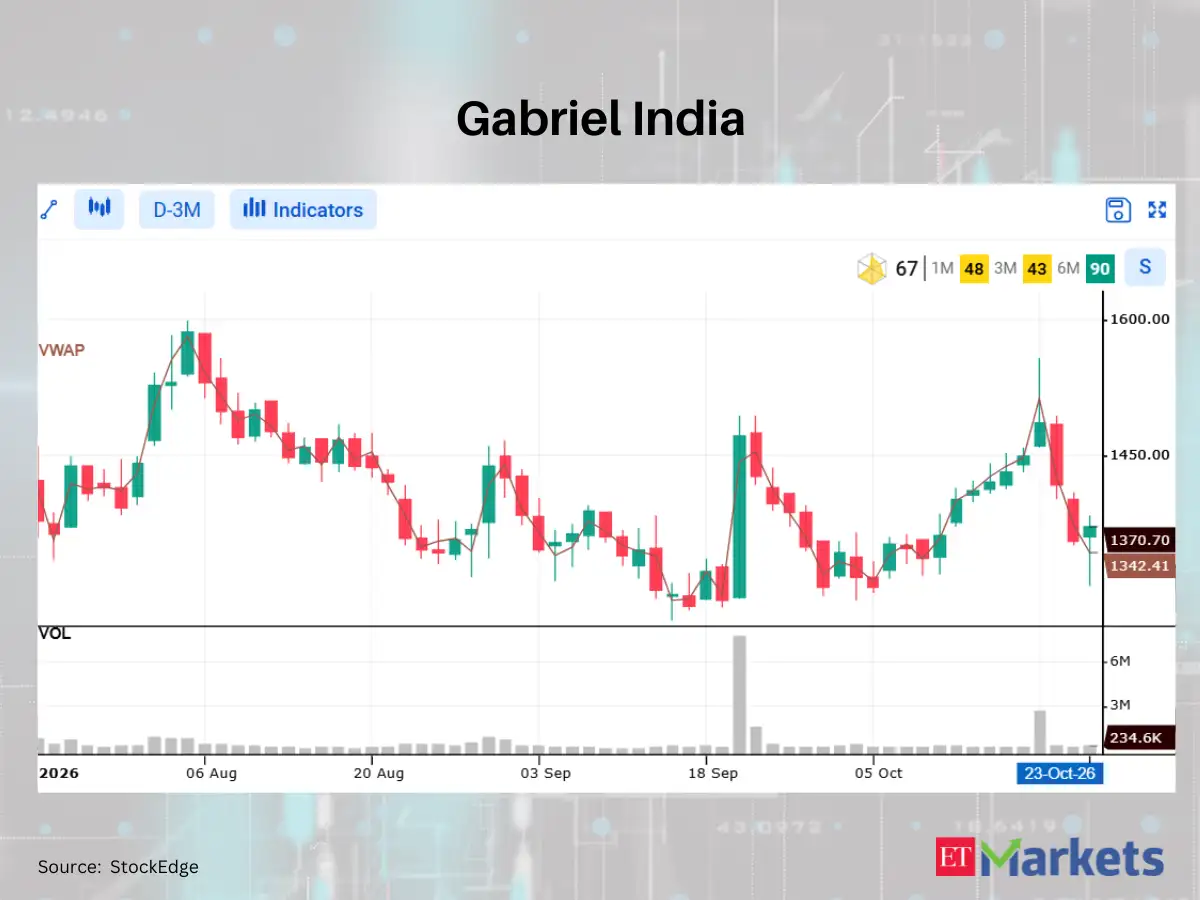
In the Nifty200 pack, five stocks' closing prices crossed below their 200-day moving averages (DMA) on October 23, according to technical scan data from StockEdge. Trading below the 200 DMA is generally considered a negative signal, as it suggests that a stock’s price is below its long-term trend. The 200 DMA is a…Read the original at Economic Times
Key takeaways
- Category: Sector.
- AI reads the tone as negative (potentially bearish) for the stock.
- Assessed as a significant, market-relevant update.
Why it matters
A meaningful update worth tracking. The tone is negative — watch for downside reaction. Use the price and stock snapshot to gauge how the market is responding.