Neutral impactStocks
Nifty 50 tests 38.2% Fib resistance after Double Bottom: Live
Investing.com India 2 hrs ago·2 Nov 2026, 4:06 am
Stocks Investing.com India
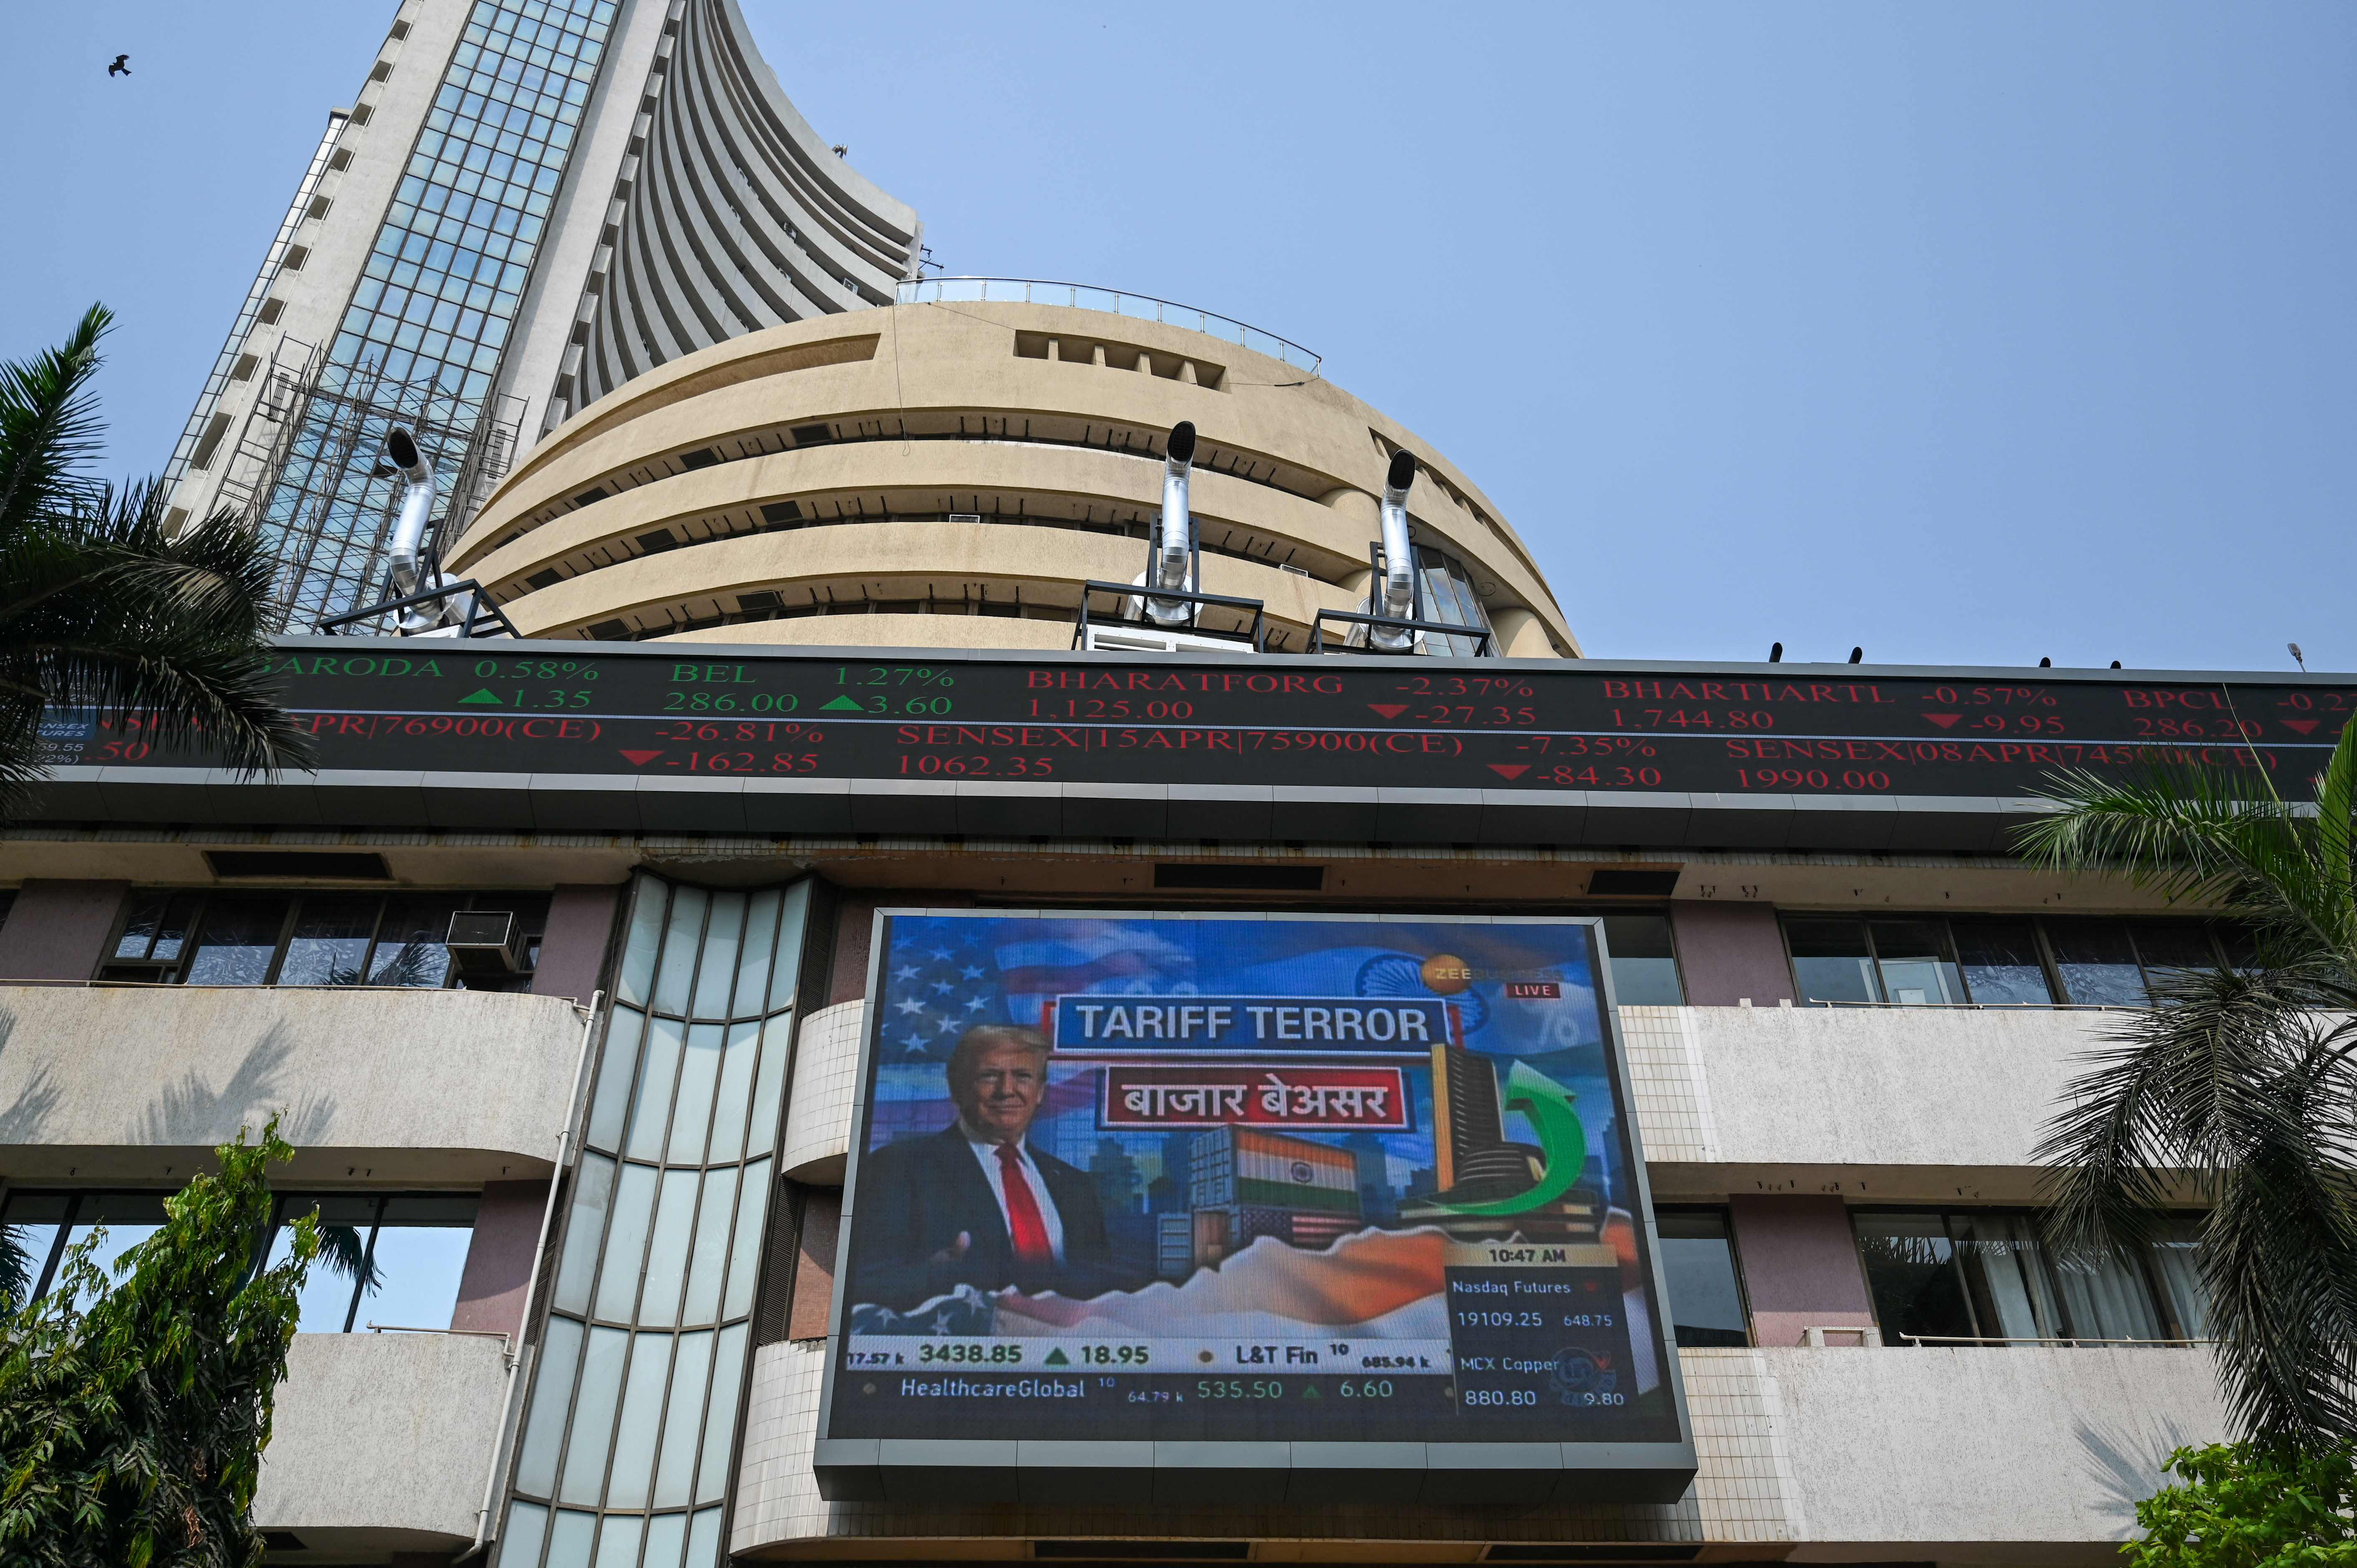
The Nifty 50 index has recently formed a 'double bottom' pattern, a technical signal that often suggests a reversal of a downward trend. This formation occurred as the index found support at a key level, prompting a recovery attempt. Currently, the market is facing resistance near the 38.2% Fibonacci retracement level, a technical threshold where past price action has historically faced selling pressure.
For investors, this technical setup is significant because it highlights a potential battle between buyers and sellers. The double bottom indicates that the market may have stabilized, but the resistance level suggests that further gains are not guaranteed. This creates a critical area where market participants will closely watch for signs of whether the index can break through or if it will consolidate.
Moving forward, the key focus for traders will be the market's reaction at this resistance point. A decisive breakout above the 38.2% level could signal continued momentum, while rejection may lead to a period of consolidation. Observing volume and broader market breadth will be essential to gauge the strength of any potential move.
Key takeaways
- Category: Stocks.
Why it matters
A routine update. Use the price and stock snapshot to gauge how the market is responding.