Nifty Next 50 vs Nifty Smallcap 250 – Understanding Their Index Construction and Portfolio Exposure
Telangana Today 1 hr ago·24 Sept 2026, 1:28 pm
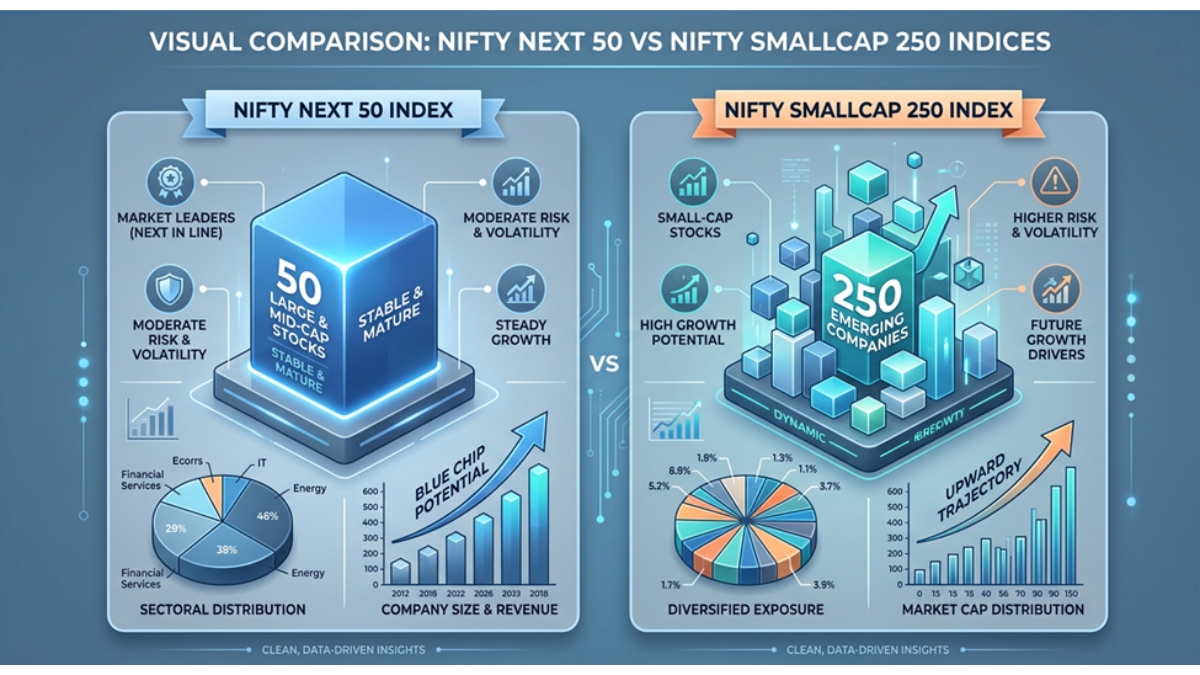
The Nifty Next 50 and Nifty Smallcap 250 are two key benchmarks that help investors understand the broader Indian equity market beyond the top 50 companies. The Nifty Next 50 tracks the next set of large-cap companies, offering exposure to established firms with significant market capitalization. In contrast, the Nifty Smallcap 250 focuses on smaller companies, providing access to mid-sized and smaller enterprises that often have higher growth potential but also higher volatility. Understanding the difference in their index construction is essential for diversifying a portfolio effectively.
For investors, these indices serve as a guide to gauge market sentiment and sectoral trends. The Nifty Next 50 reflects the performance of the next tier of large-cap stocks, which can act as a bellwether for broader market stability. Meanwhile, the Nifty Smallcap 250 offers a chance to participate in the growth stories of smaller companies, which can deliver outsized returns during bullish phases but may also face significant downside risks during market downturns.
What to watch next includes tracking the performance of these indices relative to the Nifty 50, as well as monitoring sectoral allocations within them. Investors should also keep an eye on liquidity and volatility metrics, as small-cap indices tend to be more sensitive to market fluctuations. A balanced approach, considering both large-cap and small-cap exposure, can help manage risk while capturing growth opportunities in the Indian market.
Key takeaways
- Category: Economy.
- AI reads the tone as positive (potentially bullish) for the stock.
- Flagged as a high-impact, market-moving story.
Why it matters
This is a high-impact development and could move the stock. The tone is positive — historically associated with upward pressure, though not predictive. Use the price and stock snapshot to gauge how the market is responding.