Neutral impactStocks
Nifty Rebounds, Doji Near 50 DEMA Signals Indecision - Tradebulls Securities Pvt Ltd
Investment Guru 1 hr ago·21 Aug 2026, 4:23 am
Stocks Investment Guru
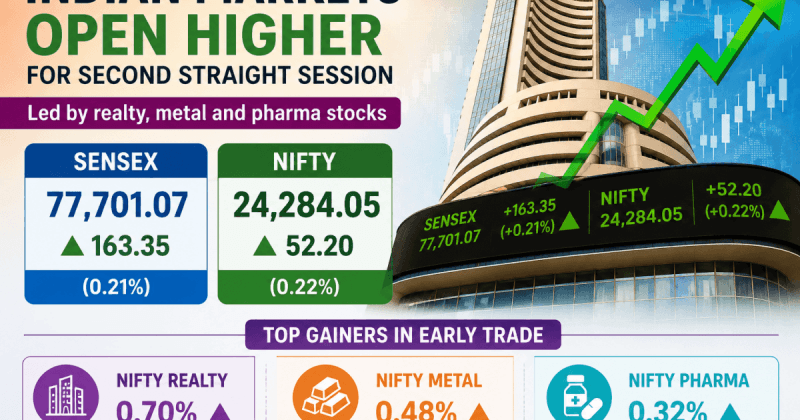
The Indian stock market, represented by the Nifty 50 index, has shown signs of recovery after recent declines. However, the index is currently struggling to find a clear direction, as indicated by a 'Doji' candlestick pattern on the daily chart. This pattern typically suggests market indecision, where buyers and sellers are in a stalemate.
For investors, this period of consolidation is significant. It implies that the recent rally may be losing momentum, and the market is waiting for fresh triggers to move higher. The proximity of the index to the 50-day Exponential Moving Average (DEMA) adds to this uncertainty, as a break above this level could signal a resumption of the uptrend.
Investors should keep a close watch on the index's ability to hold above the 50-day DEMA. A decisive move above this key level could attract fresh buying interest, while a breakdown might lead to further consolidation. Monitoring volume and global cues will also be crucial to gauge the market's next move.
Excerpt from Investment Guru
CM Bhupendra Patel pitches GIFT City, emerging sectors to Gujarati diaspora in Washington Key Highlights: Stocks in News, Economic & Global Updates 21st August 2026 by GEPL Capital Ltd Daily Update Report 21st August 2026 by Ventura Securities Ltd Please click the activation link we sent on your email An email has…Read the original at Investment Guru
Key takeaways
- Category: Stocks.
Why it matters
A routine update. Use the price and stock snapshot to gauge how the market is responding.