Neutral impactStocks
NSE:NIFTY Chart Image by Hkd88
TradingView 12 hrs ago·14 Sept 2026, 7:17 am
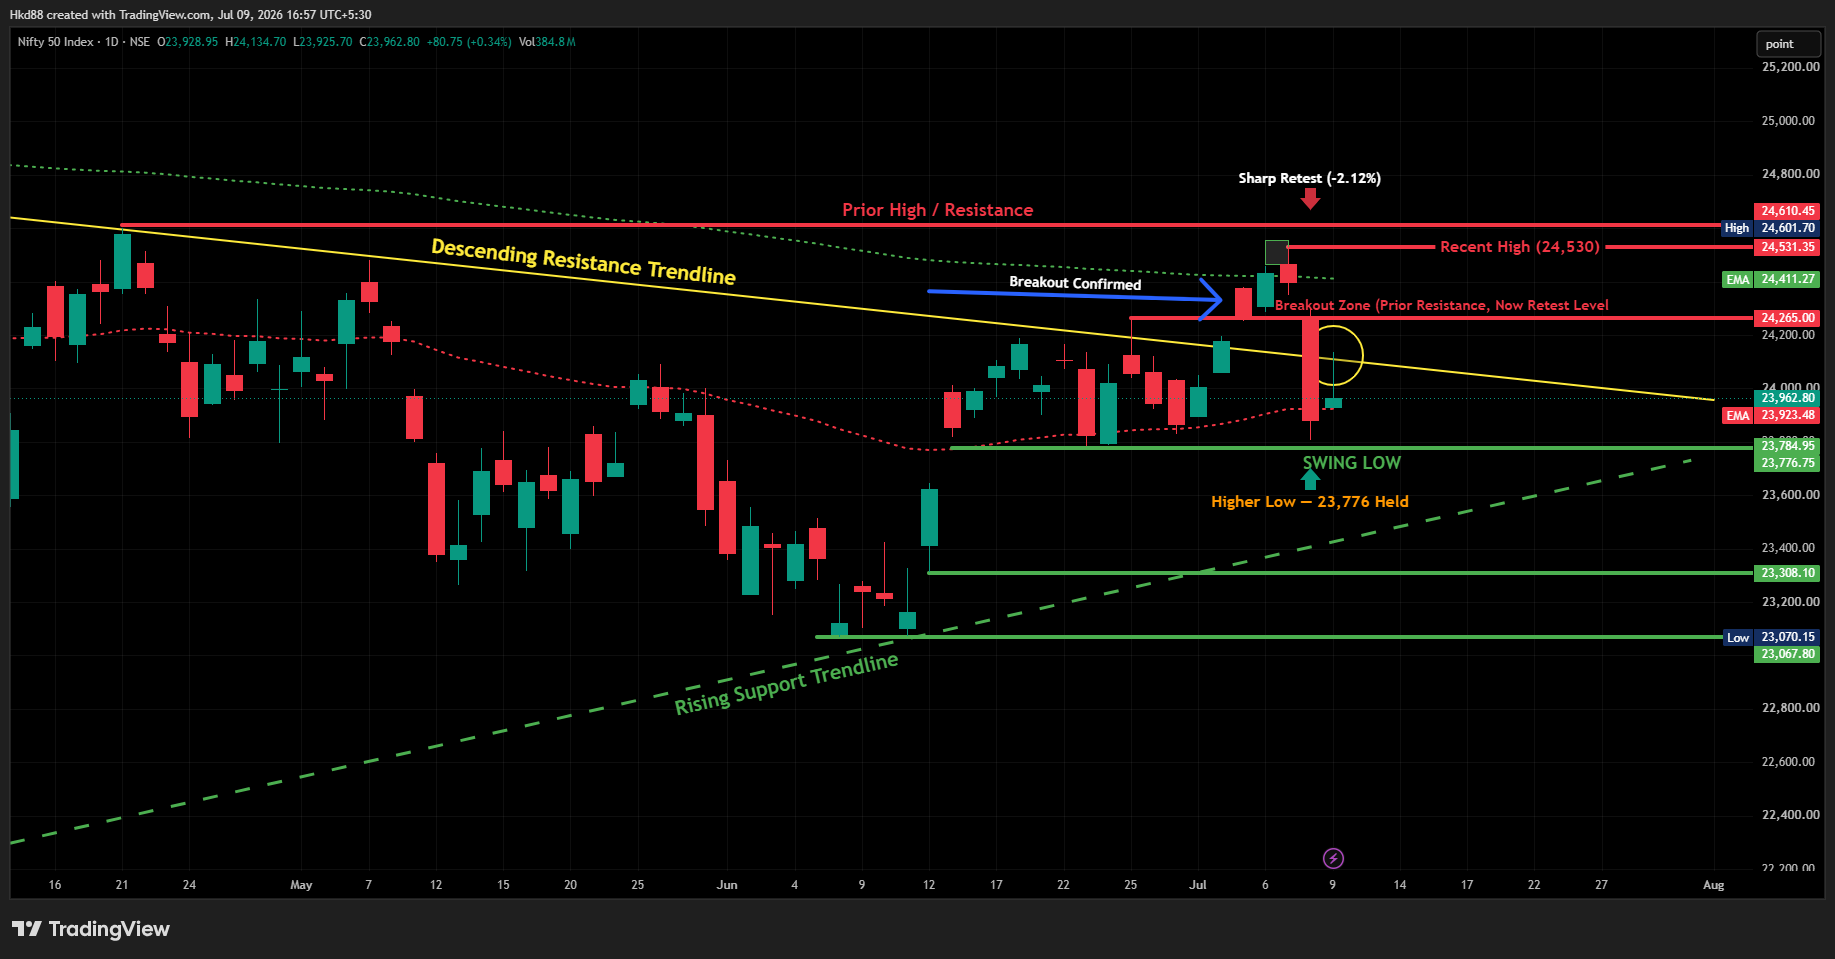
Nifty 50 has formed a large chart pattern resembling a 'head and shoulders' formation. This is a technical signal that often suggests a reversal in the market's current upward trend. It indicates that the previous momentum might be losing steam.
For investors, this pattern serves as a warning sign. It implies that the broader market could be approaching a period of consolidation or a potential decline. It is a crucial moment to review your portfolio and assess the risk levels of your existing holdings.
Investors should watch for the index breaking below the 'neckline' of this pattern. A decisive close below this level could trigger a significant sell-off. Conversely, holding above the neckline might suggest the trend is still intact.
Key takeaways
- Category: Stocks.
Why it matters
A routine update. Use the price and stock snapshot to gauge how the market is responding.