Positive impactStocks
Nuvama Wealth Management among 5 stocks showing White Marubozu pattern
Economic Times 1 hr ago·13 Oct 2026, 3:58 am
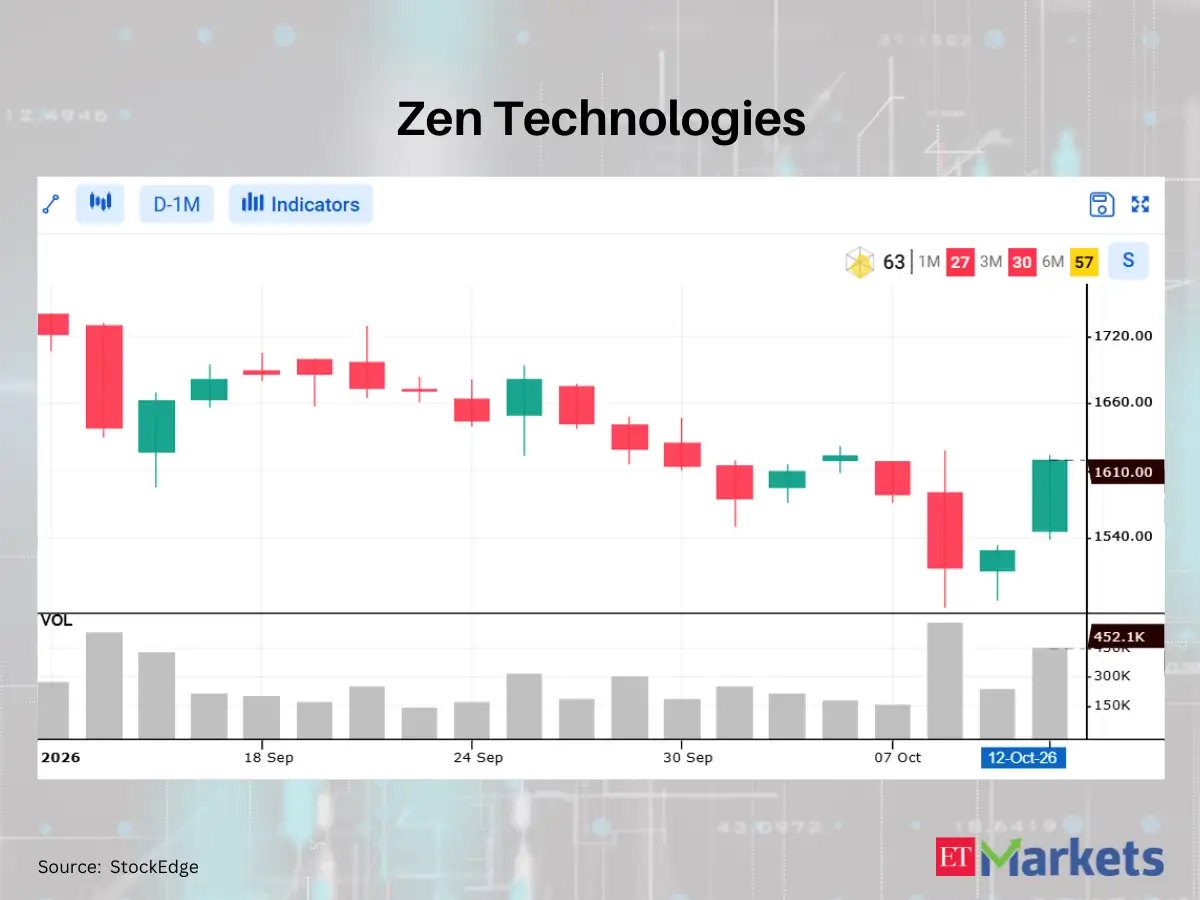
Nuvama Wealth Management is among five Nifty 500 stocks that displayed a White Marubozu candlestick pattern on October 12. This technical formation is considered a bullish signal, indicating that the stock opened near its low and closed at or near its high for the day. The pattern suggests strong buying interest and a clear upward price momentum throughout the trading session.
For investors, this technical move highlights a period of aggressive buying and positive market sentiment. While a single day's pattern does not guarantee future performance, it can signal a short-term breakout or a shift in trend. Investors should monitor the stock's subsequent price action to see if the momentum continues or if the gains are sustained in the coming sessions.
Moving forward, it is important to watch for volume support and the stock's reaction to key resistance levels. A sustained move above recent highs would confirm the bullish trend, whereas a failure to hold gains could indicate a temporary rally. Investors should assess their own risk tolerance before making any decisions based on such technical indicators.
Excerpt from Economic Times
On October 12, five Nifty500 stocks that gained over 5% appeared on the White Marubozu bullish scanner, according to StockEdge’s technical scan data. A White Marubozu is a bullish candlestick pattern in technical analysis that occurs when the opening price is the lowest for a given period and the closing price is the…Read the original at Economic Times
Affected stocks
Bullish1 stock
Bull / bear label is derived from the article's AI sentiment — indicative, not advice. Prices may be delayed.
Key takeaways
- Concerns Nuvama Wealth Management (NUVAMA).
- Category: Stocks.
- AI reads the tone as positive (potentially bullish) for the stock.
- Assessed as a significant, market-relevant update.
Why it matters
A meaningful update for Nuvama Wealth Management worth tracking. The tone is positive — historically associated with upward pressure, though not predictive. Use the price and stock snapshot to gauge how the market is responding.