Sensex and Nifty Slip as Market Breadth Weakens; IT Sector Shines Amid Broad Declines
MarketsMojo 1 hr ago·2 Oct 2026, 6:32 am

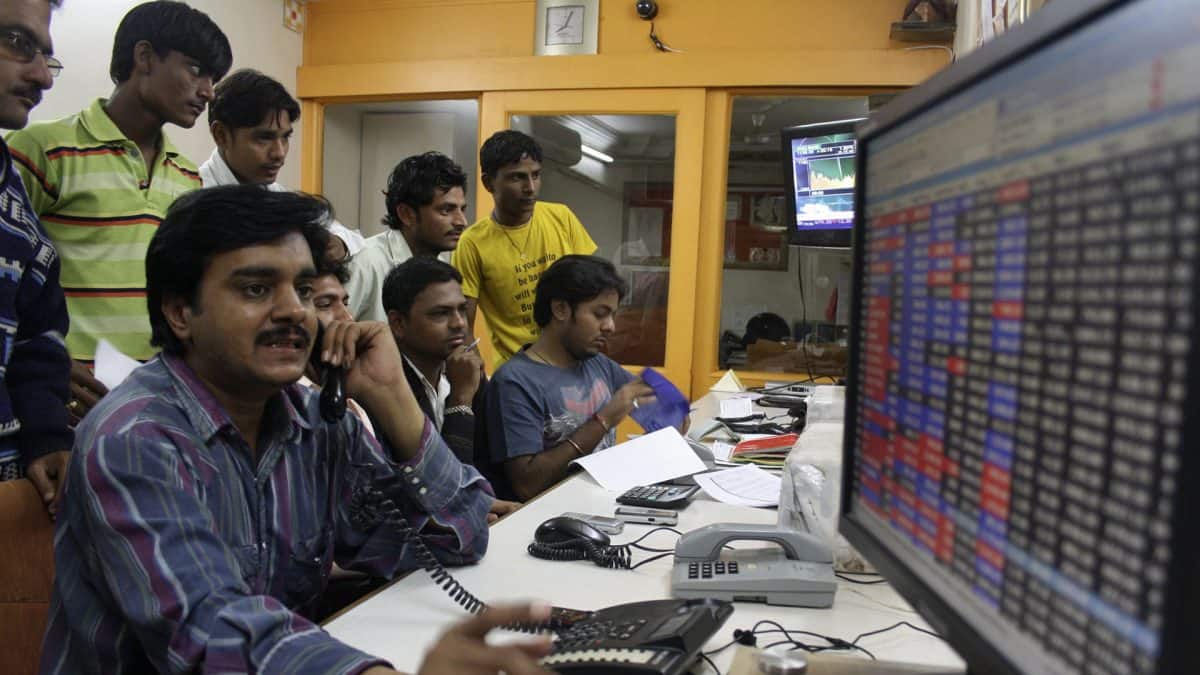
The benchmark indices, Sensex and Nifty, experienced a pullback today as broader market sentiment soured. While the headline indices managed to limit their losses, the market breadth was weak, indicating that a majority of stocks were trading in the red. This divergence suggests that while large-cap stocks held their ground, mid and small-cap segments faced significant selling pressure.
For investors, this shift in breadth is a key signal to monitor. It highlights a growing divergence between the top performers and the rest of the market. While the IT sector stood out as a bright spot, the general weakness in other sectors suggests that volatility could persist. Investors should focus on stock-specific performance rather than relying solely on index movements.
Moving forward, the focus will be on whether this weakness in breadth is a temporary correction or the start of a broader trend. Traders will be watching for signs of recovery in the mid and small-cap space, as well as the sustainability of the IT sector's gains. A recovery in breadth would be a positive indicator for the market's health.
Excerpt from MarketsMojo
Market Indices and Technical Trends The Nifty50 index remains under pressure, trading 1.07% above its 52-week low of 22,182.55. Technical indicators suggest a bearish trend as the index closed below its 50-day moving average (DMA), which itself is positioned below the 200 DMA, signalling a potential continuation of…Read the original at MarketsMojo
Key takeaways
- Category: Stocks.
- AI reads the tone as negative (potentially bearish) for the stock.
- Flagged as a high-impact, market-moving story.
Why it matters
This is a high-impact development and could move the stock. The tone is negative — watch for downside reaction. Use the price and stock snapshot to gauge how the market is responding.