Negative impactCompany
This data analytics and solutions provider stock is set for its worst week in six years
CNBC-TV18 1 hr ago·30 Oct 2026, 7:16 am
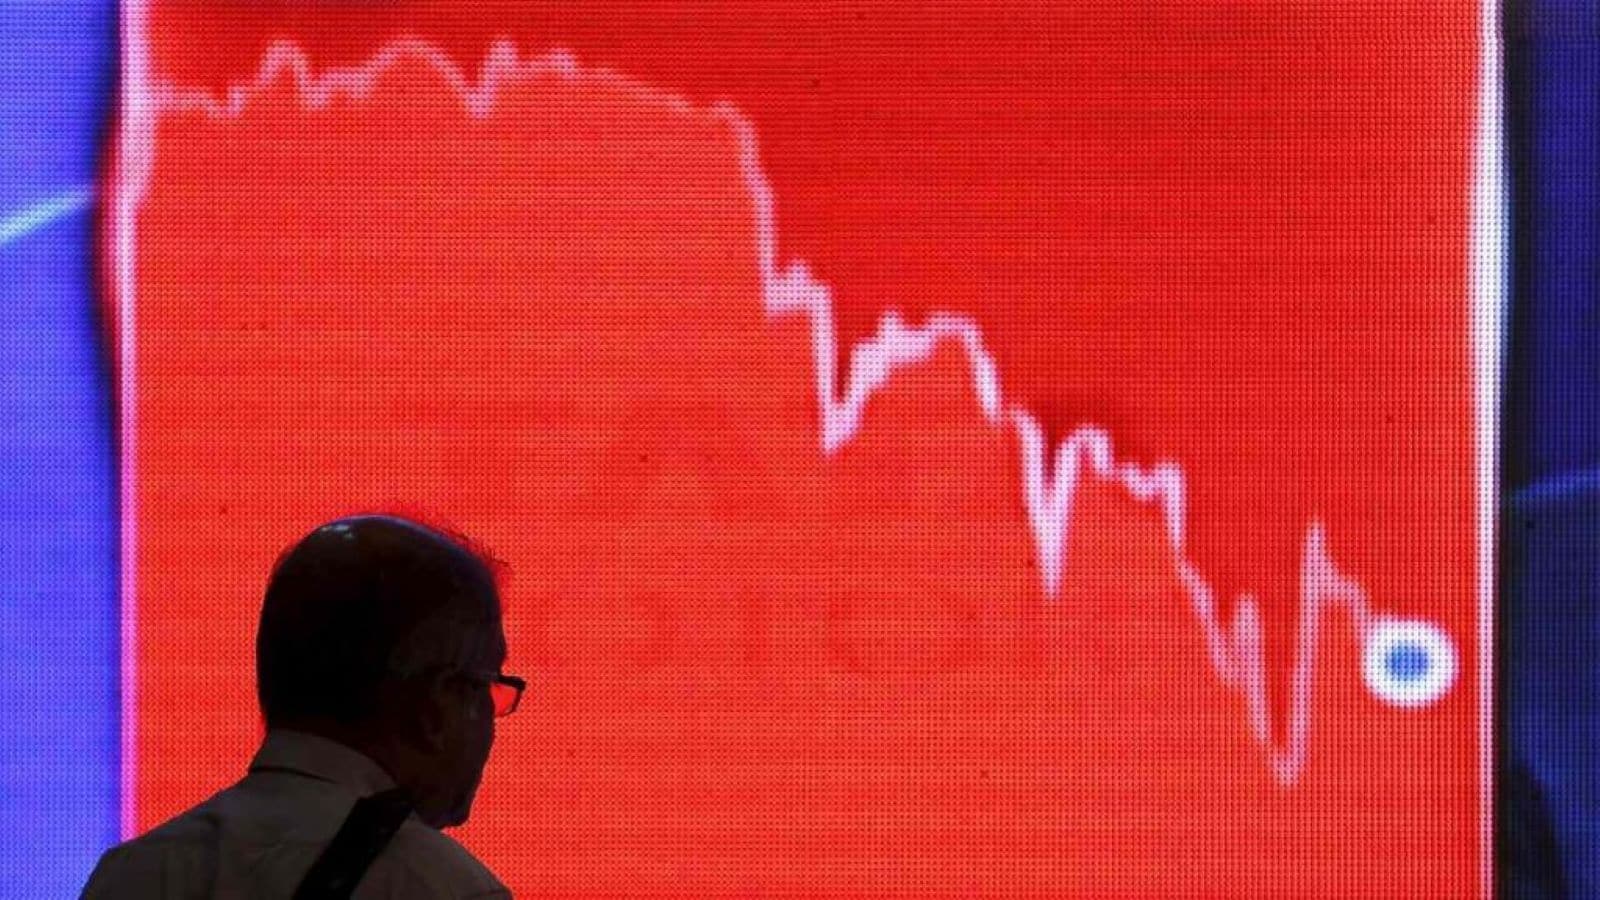
eClerx Services is experiencing a challenging week, with its shares dropping significantly. This decline has pushed the stock below several key technical indicators, including its 200-day moving average. This technical breakdown often signals that the stock's recent upward trend has broken down, potentially attracting more selling pressure from traders.
For investors, this technical weakness is a key development to monitor. It suggests that the stock's momentum has shifted and that the path of least resistance is now to the downside. The fact that the price is now below a major benchmark like the 200-day average indicates a period of potential consolidation or further decline.
Moving forward, the focus will be on whether the stock can stabilize or if the selling pressure will continue. Investors should watch for a potential rebound attempt or a breakout below recent lows, as these will be the primary indicators of the stock's next major move.
Excerpt from CNBC-TV18
Published On Oct 30, 2026 | 12:43 IST Last Updated On Oct 30, 2026 | 12:46 IST With the fall seen by shares of eClerx this week, the stock has slipped below all of its key moving averages. The 200-Day Moving Average is now at ₹1,743, from which the stock is now significantly below. Shares of eClerx Services Ltd. are…Read the original at CNBC-TV18
Key takeaways
- Category: Company.
- AI reads the tone as negative (potentially bearish) for the stock.
Why it matters
A routine update. The tone is negative — watch for downside reaction. Use the price and stock snapshot to gauge how the market is responding.