Positive impactSector
Vedanta Power among 6 stocks showing RSI trending up
Economic Times 1 hr ago·15 Oct 2026, 3:31 am
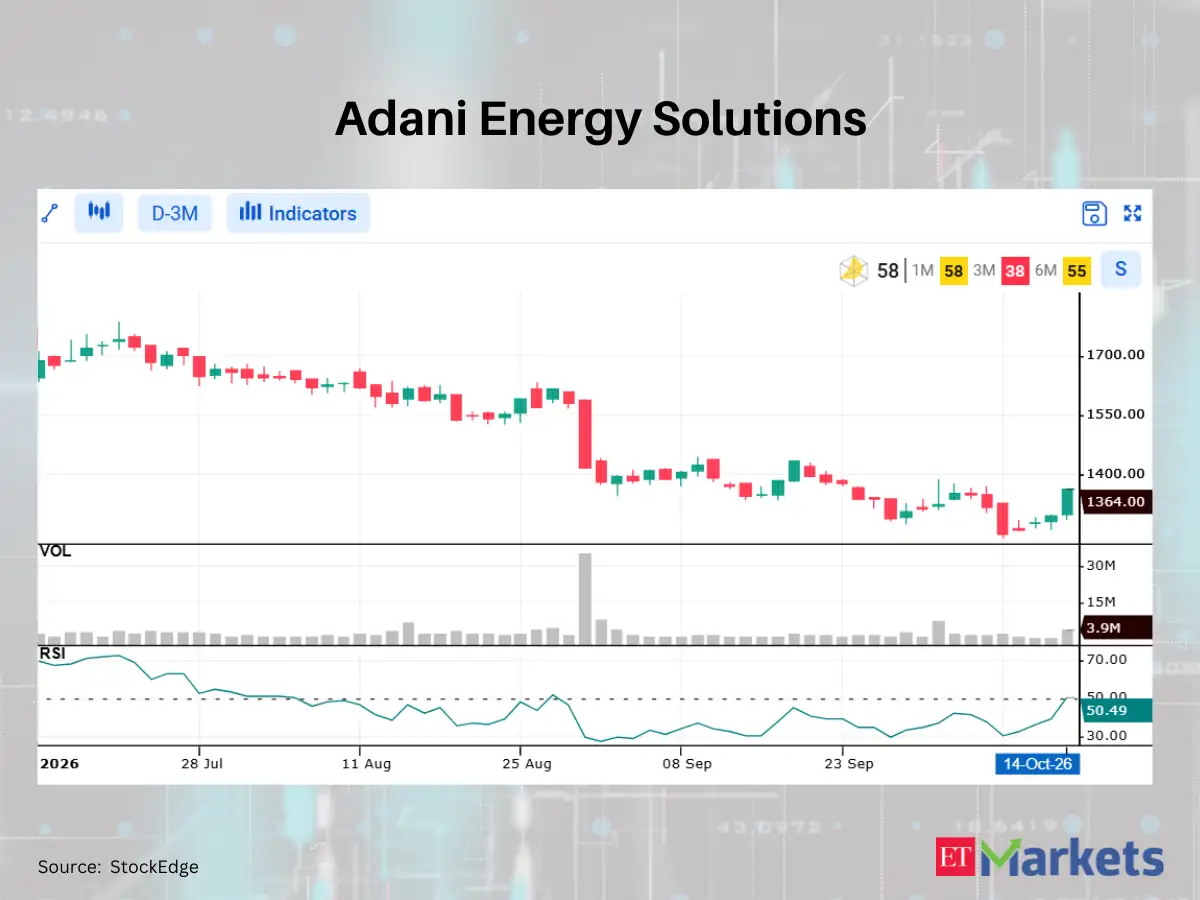
Vedanta Power has recently appeared in a technical scan that tracks stocks with an upward-trending Relative Strength Index (RSI). This indicator measures the speed and change of price movements, and a rising RSI above 50 is often interpreted by traders as a sign that the stock's momentum is shifting from a downtrend to an uptrend. For investors, this technical signal suggests the stock may be gaining strength and attracting buying interest.
While a rising RSI indicates improving price momentum, it does not guarantee future price increases. It is important to remember that technical indicators are lagging and can sometimes signal a reversal too early. Investors should use this information as a data point to gauge market sentiment but should also look at the broader market context and the company's fundamentals before making any investment decisions.
Moving forward, investors will want to watch if the price action can sustain this momentum. A break above key resistance levels would confirm the bullish trend, while a failure to hold these gains could signal a pause in the rally. Monitoring volume alongside the RSI can also provide further clarity on the strength of the move.
Affected stocks
Bullish1 stockBull / bear label is derived from the article's AI sentiment — indicative, not advice. Prices may be delayed.
Key takeaways
- Concerns Vedanta Power (VEDPOWER).
- Category: Sector.
- AI reads the tone as positive (potentially bullish) for the stock.
Why it matters
A routine update for Vedanta Power. The tone is positive — historically associated with upward pressure, though not predictive. Use the price and stock snapshot to gauge how the market is responding.