Neutral impactStocks
NSE_DLY:NIFTY Chart Image by Dinesh_Kryptonian
TradingView 2 hrs ago·3 Oct 2026, 2:01 pm
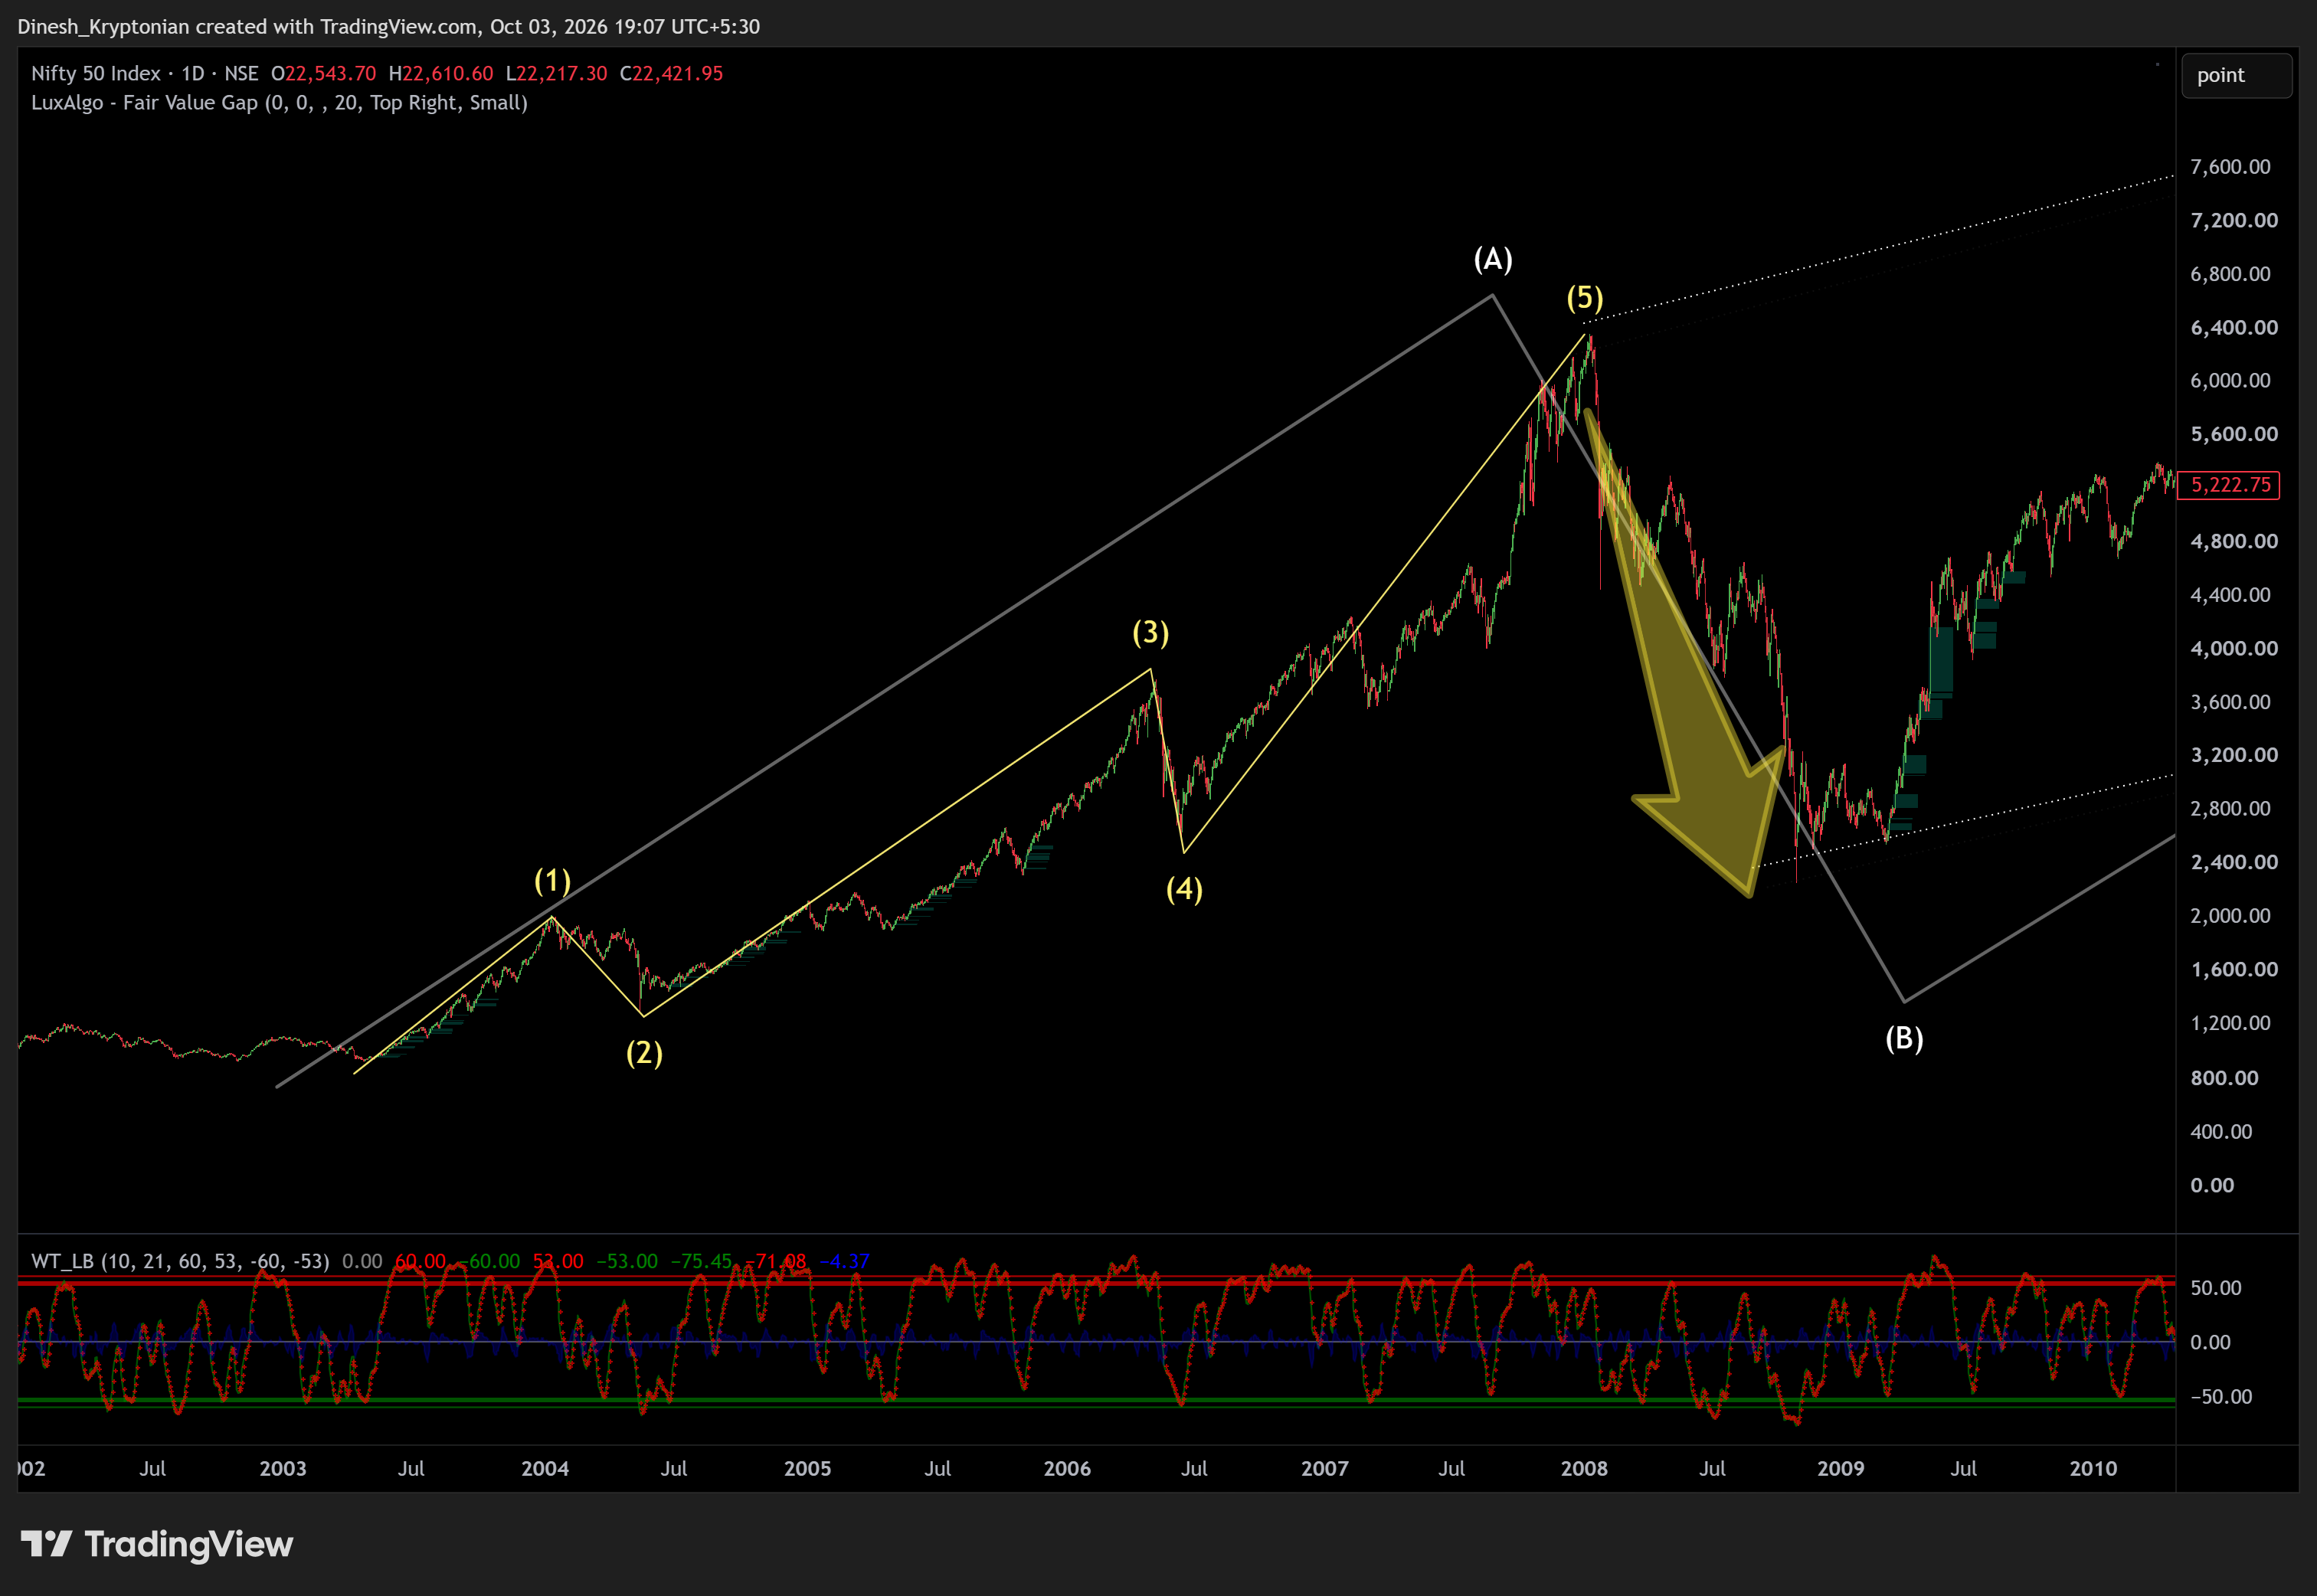
The Nifty 50 index recently formed a specific chart pattern known as a 'head and shoulders,' which is often viewed as a bearish signal by technical analysts. This pattern typically consists of three peaks, with the middle peak being the highest, resembling a head flanked by two smaller shoulders.
For investors, this development suggests that the market's upward momentum might be losing steam. It implies that the recent rally could be nearing a turning point, potentially leading to a correction if the index fails to break above the neckline of the pattern.
Traders should watch the index closely for a decisive move below the neckline support level. A confirmed breakdown could trigger further selling pressure, while a strong rebound above the neckline might invalidate the bearish forecast and sustain the current uptrend.
Key takeaways
- Category: Stocks.
Why it matters
A routine update. Use the price and stock snapshot to gauge how the market is responding.