India 10-year bond yield tops 7.35% as RBI's liquidity clamp down hurts
Economic Times 1 hr ago·12 Oct 2026, 5:19 am
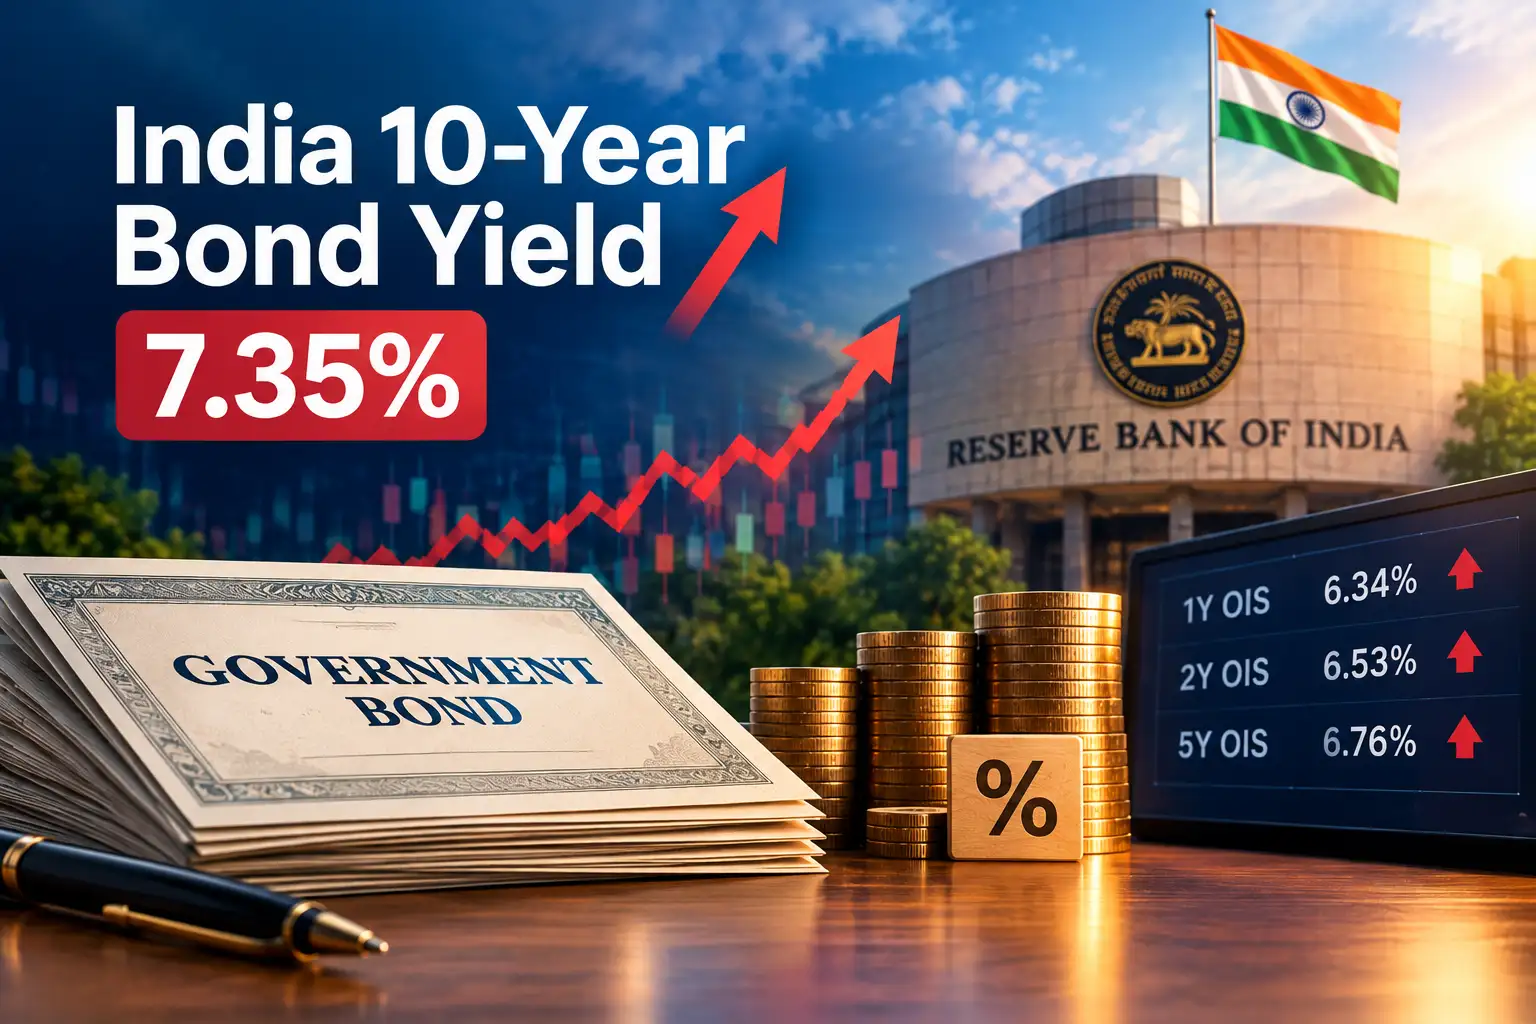
The Reserve Bank of India (RBI) has tightened liquidity in the banking system by selling government bonds. This move has pushed the yield on the benchmark 10-year bond above 7.35%, its highest level in three years. Higher yields make borrowing more expensive for banks and companies, which can eventually lead to higher interest rates for retail loans.
For investors, this shift signals a tightening of monetary policy. Banks, which hold a large portion of their assets in government bonds, often see their net interest margins squeezed when bond yields rise. This can impact their profitability and stock performance. The move also comes as global crude oil prices remain elevated, adding pressure to inflation and the RBI's policy stance.
Investors should watch the RBI's future policy announcements closely. If the central bank maintains this tight stance, bond yields may stay high. However, if inflation cools down, the RBI could ease its liquidity measures. This could lead to a decline in bond yields and potentially benefit bank stocks in the long run.
Excerpt from Economic Times
On Monday, Indian government bonds experienced a significant decline due to central bank measures affecting liquidity. The benchmark 6.94% 2036 bond yield rose to its highest level in three years. The Reserve Bank of India announced it would sell 250 billion rupees of bonds to tighten liquidity. Meanwhile, the…Read the original at Economic Times
Affected stocks
Bearish1 stock
Bull / bear label is derived from the article's AI sentiment — indicative, not advice. Prices may be delayed.
Key takeaways
- Concerns Bank of India (BANKINDIA).
- Category: Economy.
- AI reads the tone as negative (potentially bearish) for the stock.
- Flagged as a high-impact, market-moving story.
Why it matters
This is a high-impact development for Bank of India and could move the stock. The tone is negative — watch for downside reaction. Use the price and stock snapshot to gauge how the market is responding.